
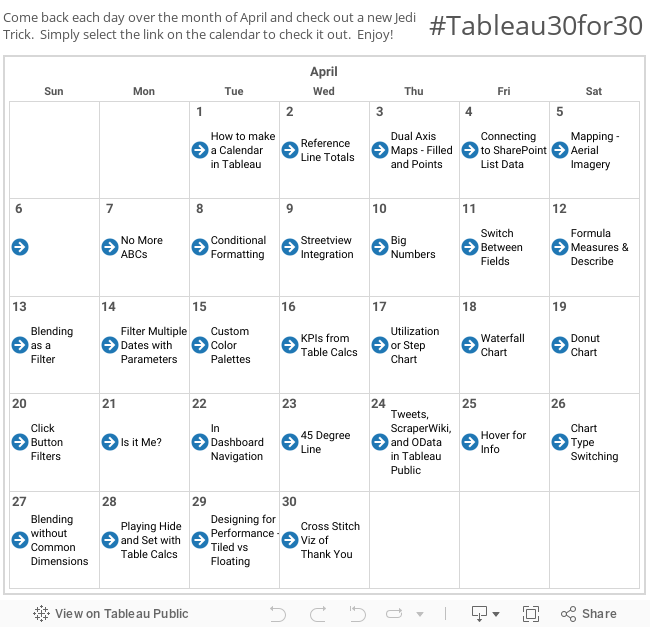
While at the ATUG Event yesterday, our fearless leader Andy Piper was showing off the ATUG Tableau Public submission to the User Group contest that's going on. He showed how he had hid the important info of the dashboard by making it appear when the user hovered over an icon. To my surprise, there were a number of people in the room that got really interested in how he did that. So this is a very quick trick how to create a Hover for Info Button.
First off we need a button, a graphic that jumps out and get your attention and says "Hey! Over here! I have information that you need!" To Google Images we go...

Something like one of these - don't pick something annoying, but don't pick something that's going to blend into the background. Save it as a .png, and hop over to the shapes folder in My Tableau Repository (My Documents>>My Tableau Repository>>Shapes), create a new folder and call it "Info".
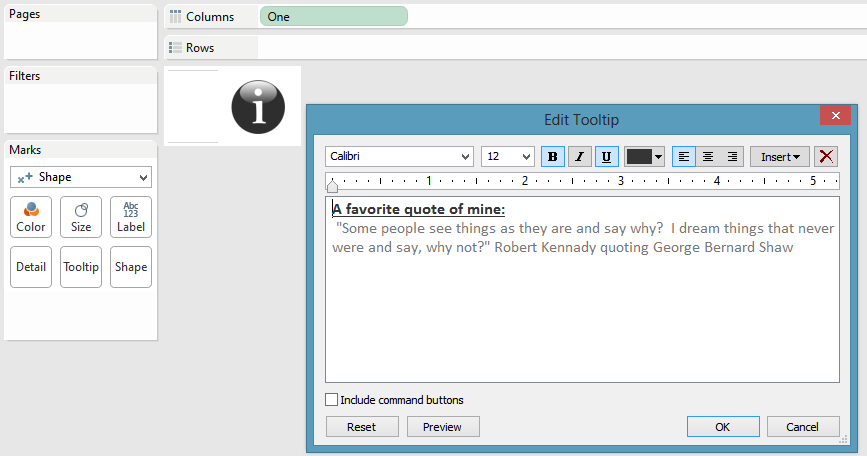
Now pop open Tableau and we're going to create this hover button for an existing dashboard. In just the same way that we created some of the other buttons previously, we're going to start by taking the calculated field "One" (=1), putting it on the columns shelf, and changing it to a dimension (getting rid of the Sum). We've done this a few times now so I'm sure you're getting the hang of it. You should be here:

Click on Shape and go through the folders until you find the folder "Info" that you just created.

Can't find it? Hit the Reload Shapes button highlighted below:

Alright your shape has now change to this info icon. Now for the trick. After a little formatting clean up, click on the tooltip button and type in what ever you want. Here's what I did:
Now, once that's all done, we'll bring this sheet on to a dashboard so that when the user hovers they'll see that text appear. This works really well when you need to include detailed instructions for a first time user, but don't want to sacrifice space on the dashboard for it. And here's the final product on top of the "Day 21: Is it Me" dashboard:
That's it! Thanks again for stopping by. The countdown continues! 5 to go!
Nelson
Question on info icon texts: Can they be parameterized similarly to dynamic text boxes? I have a case that I'd like to display slightly different info texts depending on the filtering being applied in the dashboard (different definitions of what the benchmarking is depending on the slicing of data). Possible?
ReplyDeletenice blog , very helpful and visit us for VISUALIZATION SERVICES in UK
ReplyDelete