
I'm going to let Peter provide the setup here (his words in italics, and we're both using Superstore data):
The situation is this: You've got a time series based table calculation going on that you are interested in showing, something like a running total, YTD total or difference from last month, however you don't want to show all the data - instead you only want to show the latest month.
Your starting position might look something like this below, with year, month, sum of sales, monthly difference in sales and running total.

Now lets say you only want to show the latest month, in this case December 2013. Well the first thing that springs to mind might be to filter, but that messes with the calculations PLUS its not going to automatically update to the latest month when the data updates:

Now the next idea you have might be to HIDE the 'non latest month' data, and that will solve the issue of the filters messing up the table calculations, but its still going to leave you with a problem when you get a new months worth of data you want to automatically show. So this is what you can do....Click to see Peter's solution/keep reading to see mine...
I'm going to right click on Order Date and find something you may not have noticed before - Create Custom Date:

And we'll get this interesting dialog box. Here we have the ability to tell Tableau to create a calculated field that is the same as Order Date, but at whatever slice of the Dimension we want. Never used this before? It really comes in handy in a pinch (which is what we find ourselves in) and saves some coding of calculated fields. I'm going to use the drop down to select Month/Year, like so:

Tableau now creates a brand new field for us called "Order Date (Month / Year)".
Here comes the trick (in a series of moves). I'm going to right click on this new field, and select "Create Set". What I want to do is create a set that only contains the most recent month. Another way of saying that is the Top 1 Month by Maximum Value. So we'll head to the last tab and fill it out like so:

Once we click OK, we now have a set called "Last Month". If we click and drag the set "Last Month" up to the first position on the rows shelf, we get below table and instantly realize that the sort of the In/Out in the table actually makes a difference:

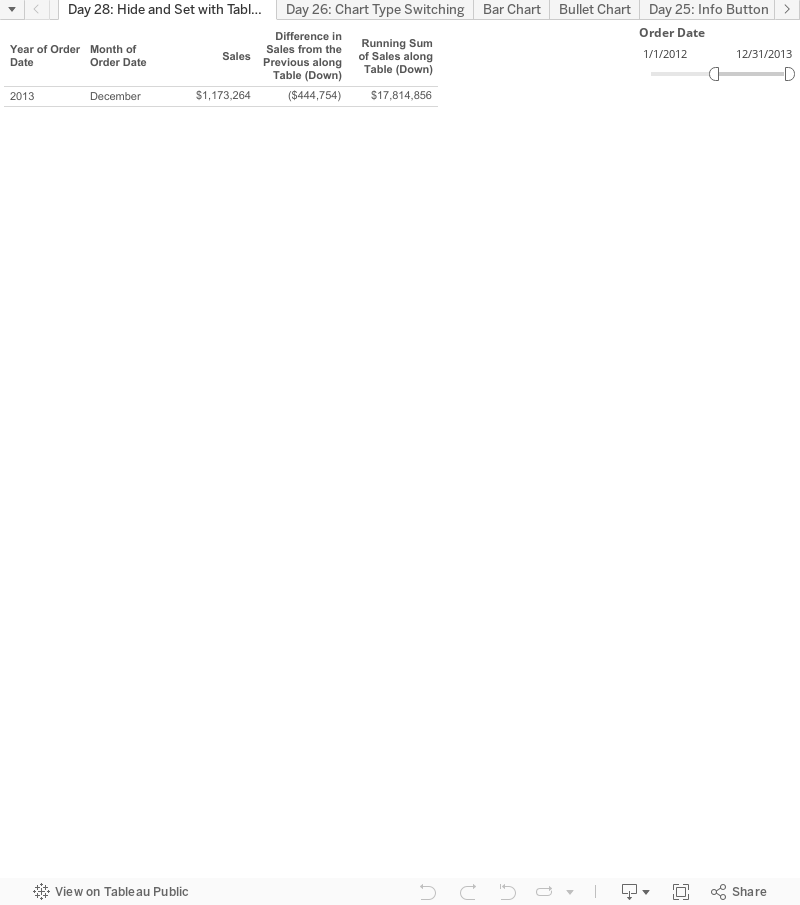
Goes to this when you put In on the bottom (giving us what we want):

Awesome! Now we simply right click on the word "Out" and select "Hide" and right click on the In/Out pill and uncheck "Show Header" and voila:

The cool part is that with both of these solutions (Peter's and mine), as the data gets updated, so will the "Last Month". The takeaway is that sets can be really helpful when dealing with Table Calcs.
Hope you enjoyed! TWO DAYS TO GO! Many thanks!
Nelson
This comment has been removed by the author.
ReplyDeletenice blog , very helpful and visit us for VISUALIZATION SERVICES in UK
ReplyDelete