
We made it. We're here. I this is probably the closest I'll ever come to feeling like I'm on top of Mount Everest. I've thought a lot about what to say at this point. I'll level with you - this was a lot harder than I thought it would be. The content was interesting and I learned a ton, but man was this time consuming. On average I'm guessing I spent 2.5 -3 hrs a night writing each one of these, cradle to grave. It made for some looooong days, many of which lasted into tomorrow. But I think I'll soon look back and be happy I took this on AND completed it. I certainly wasn't alone in this quest and I'd like to take a few moments and say thank you to a number of people:
- First off to my wife, Ms. The Vizioneer, for whom I owe about a month's worth of washing dishes, cleaning up, and paying attention to - tomorrow's May baby :) Wahoo!
- To Dan Montgomery who contributed in a number of ways along this journey and stepped up with a guest post at the end. I believe Dan favorite every single one of my #Tableau30for30 Tweets, so if you follow Dan you'll be happy May's coming as well.
- To John Mathis, Steven Carter, and Peter Gilks (the boys of Slalom), who stepped up when the towel was this close to being thrown, and provided some excellent posts that really enhanced the journey toward the end.
- To the great folks at Tableau - Ben Jones and Tara Walker - I can't believe that we were just randomly on the same page with April as Tricks and Tips month, but I'm grateful for the blog feature and Twitter hype! It was really encouraging to know that people all over the place were interested.
- And to the many of you who reached out in one way or another with many kind words of appreciation, I am honored to know that this made an impact for you.
If you've become an avid reader of the The Vizioneer, you probably shouldn't count on much new stuff coming out in May... but what am I talking about? We still have one more trick to cover for the 30th, so buckle up!
Before we get to what I ultimately did for Day 30, you should know that I've been pondering how to wrap this up for over a week. I thought about writing on the "ultimate trick", the trick to end all tricks, but it was a moving target depending on who you ask - Andy Kriebel's a pretty big fan of what he calls The Greatest Tableau Tip EVER: Exporting CSV made simple! which was worth considering. But then Andy Cotgrave and Matt Francis were big fans of putting bar charts in the the tooltip which I have to admit was a pretty awesome idea:

I'd hate to pick "the greatest trick ever" only to find out I was wrong :)
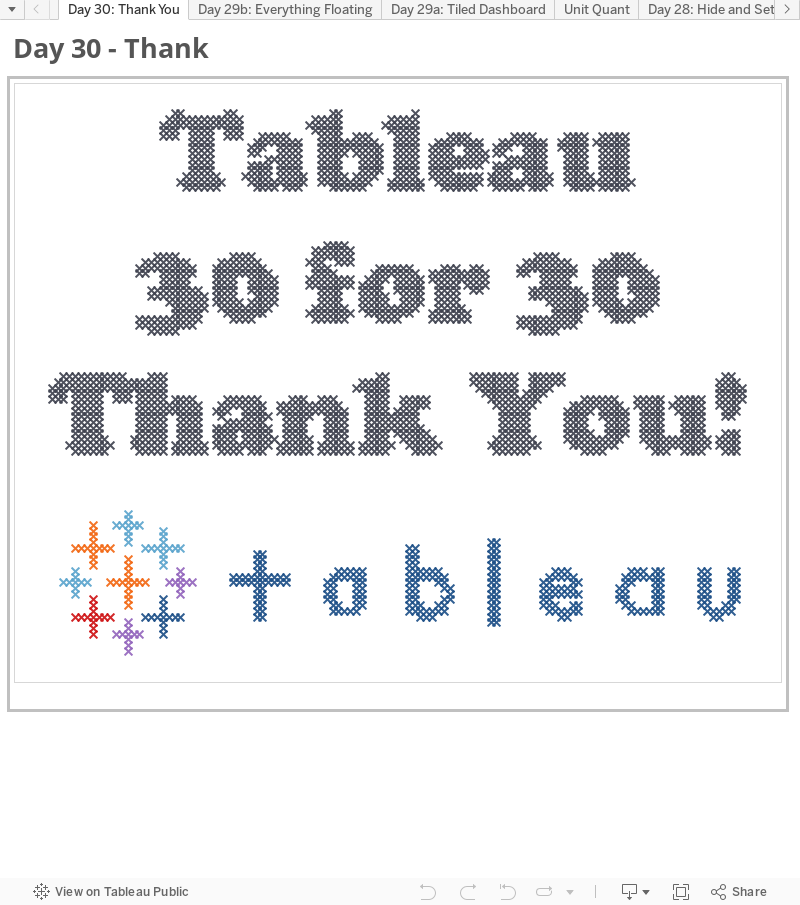
So I decided to go a different route. Inspired by Ms. Jewel Loree, creator of many beautiful Viz of the Day wins and a Tableau Public goddess, I give you Day 30 of #Tableau30for30 - Cross Stitch Viz of Thank You.
This is one of those we certainly have to show the end result before we dive it. So this is where we're headed:
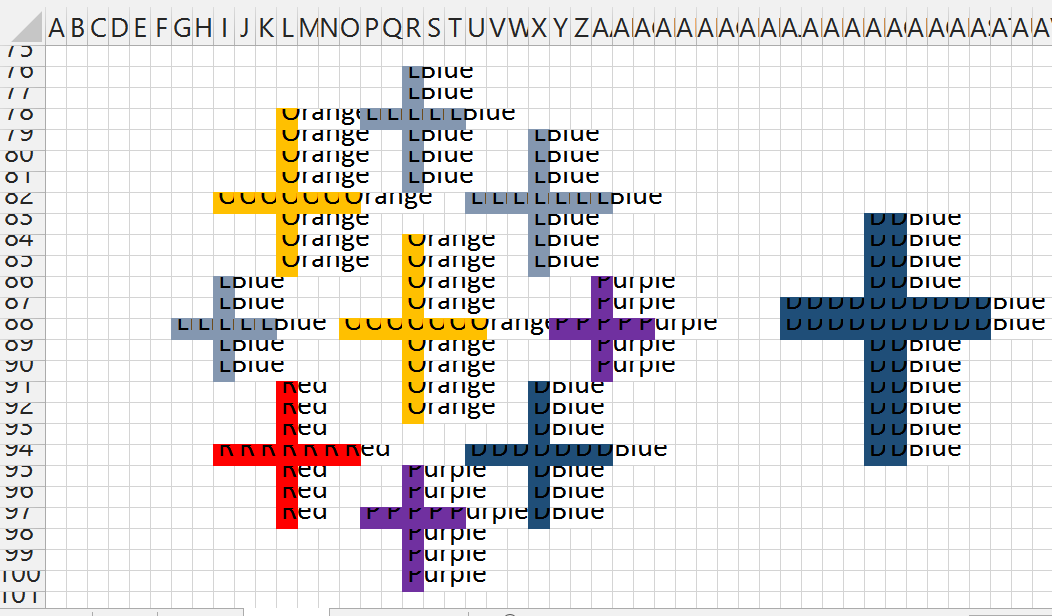
Pretty cool huh? How did we do it? Well Jewel gives a pretty awesome step by step on her blog, but I'll give you the dime tour. We actually start this shindig in Excel (because data doesn't just grow on trees or fall from the sky! It must be created!). He're what I did - I started by making each cell in Excel 10x10 pixel squares and numbered across the top and down the left side. Looks something like this:

Then inserted got some word art, found a font I liked, and wrote out a message in the word art. I then took the word art and made the fill transparent, added a solid outline and it looked something like this:

Next came the fun part. I manually went through and filled in each of the squares that had over 50% of the area as to be filled by the letters. This took a bit of time (as does anything worth doing - according to my Dad). But it soon looks like this:

You then do something that I previously didn't know was possible - Find and replace based on formating. This allows you to write in text where you have cells of a particular color. Once you go through and do everything, you have something that looks like this:
Now, some additional magic. If you haven't already downloaded the Tableau Excel Data Reshaper Add-in, then where have you been? Mother's been worried sick about you! You better go inside and eat your dinner!
We're going to start in cell B2 and select enough of the worksheet to get every bit of the design. We'll then fire up the Data Reshaper Add-in and pivot this to make it useable in Tableau. After it completes and we rename the columns we get this simple table:

It's pretty easy from here. Bring the sheet into Tableau, Y-Axis to rows and X-Axis to columns (both should be Dimensions rather than Measures), and Color on to the color shelf. Also worth noting, I had to reverse the direction of the Y-Axis (putting 1 on top, same as it was in Excel, rather than on the bottom as Tableau is used to putting it there). Selecting shape mark type and going with the "X" looking one, and.....
Voila!
We have a cross stitch you'd be proud to put up on the wall.
And with that, the sound of Boyz II Men tells me that we've come to the End of the Road.
It's been fun. Thanks for hanging out and following along. If you've enjoyed this, learned something new, or have a favorite trick I missed, hit me up on Twitter @Nelsondavis as I'd love to hear about it. I love to meet new people and TCC14 is but a short 4.5 months away - if you see me, please stop and say hey!
As always, many thanks -
Nelson
Very useful information thanks for sharing Tableau Online Training
ReplyDelete
ReplyDeleteThanks for sharing with us that awesome article you have amazing blog.....Data Scientist online training
Ever wanted to get free Twitter Followers?
ReplyDeleteDid you know you can get them AUTOMATICALLY AND ABSOLUTELY FOR FREE by registering on Add Me Fast?
If you'd like an alternative to casually picking up girls and trying to figure out the right thing to say...
ReplyDeleteIf you would rather have women chase YOU, instead of spending your nights prowling around in crowded pubs and nightclubs...
Then I encourage you to play this short video to find out a weird little secret that can literally get you your own harem of attractive women:
FACEBOOK SEDUCTION SYSTEM!!!
This comment has been removed by the author.
ReplyDeleteI like your post very much. It is very much useful for my research. I hope you to share more info
ReplyDeleteabout this. Keep posting!! Best Devops Training Institute
nice blog , very helpful and visit us for VISUALIZATION SERVICES in UK
ReplyDeleteI read testimonies and reviews about him so I contacted him immediately, explained my problems to him. Same day , he casted a spell for me and assured me for 2 days that my husband will return to me and to my greatest surprise the third day my husband came knocking on my door and begged for forgiveness. I am so happy that my love is back again and not only that, we are about to get married again, he proposed. I wouldn't stop talking about him. Contact him today if you need his help via email: emutemple@gmail.com and you will see that your problem will be solved without any delay. Website: https://emutemple.wordpress.com/ whatsapp number +2347012841542
ReplyDeleteIt was good experience to read about dangerous punctuation. Informative for everyone looking on the subject.
ReplyDeletedata scientist training in hyderabad
360DigiTMG, the top-rated organisation among the most prestigious industries around the world, is an educational destination for those looking to pursue their dreams around the globe. The company is changing careers of many people through constant improvement, 360DigiTMG provides an outstanding learning experience and distinguishes itself from the pack. 360DigiTMG is a prominent global presence by offering world-class training. Its main office is in India and subsidiaries across Malaysia, USA, East Asia, Australia, Uk, Netherlands, and the Middle East.
ReplyDelete